09_R_introduction
By Yan Li
PhD in Bioinformatics, University of Liverpool
Approaching R
R: an open source programming language for statistical analysis
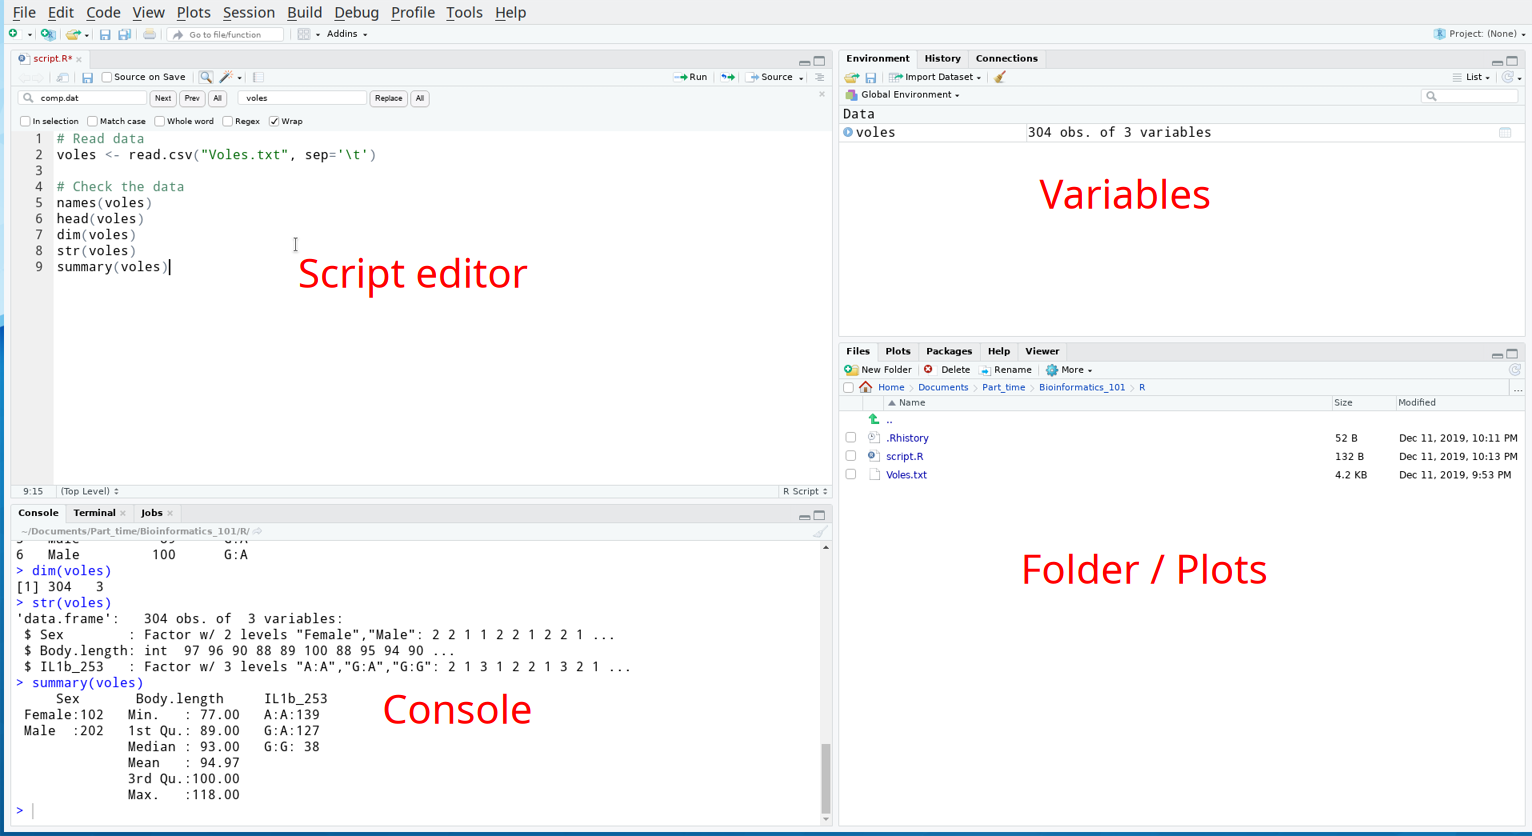
- Get familar with the interface of R-studio
- Use R-studio manage package
- Use R to perform a t-test
- Use R to visualise data
R-studio
Set working directory
- Click
Session-Set Working Directory-Choose Directory - Or simply use cmd
setwd("your/working/directory")
Import data and check
# Read data
voles <- read.csv("Voles.txt", sep='\t')

# Check the data
names(voles)
head(voles)
summary(voles)
Subset
volesmh <- subset(voles, Sex=="Male" & IL1b_253=="G:A")
summary (volesmh)
Simple plot
barplot()
boxplot()
hist()
plot()
pie()
...
Simple statistic
mean()
median()
sd()
sum()
t.test()
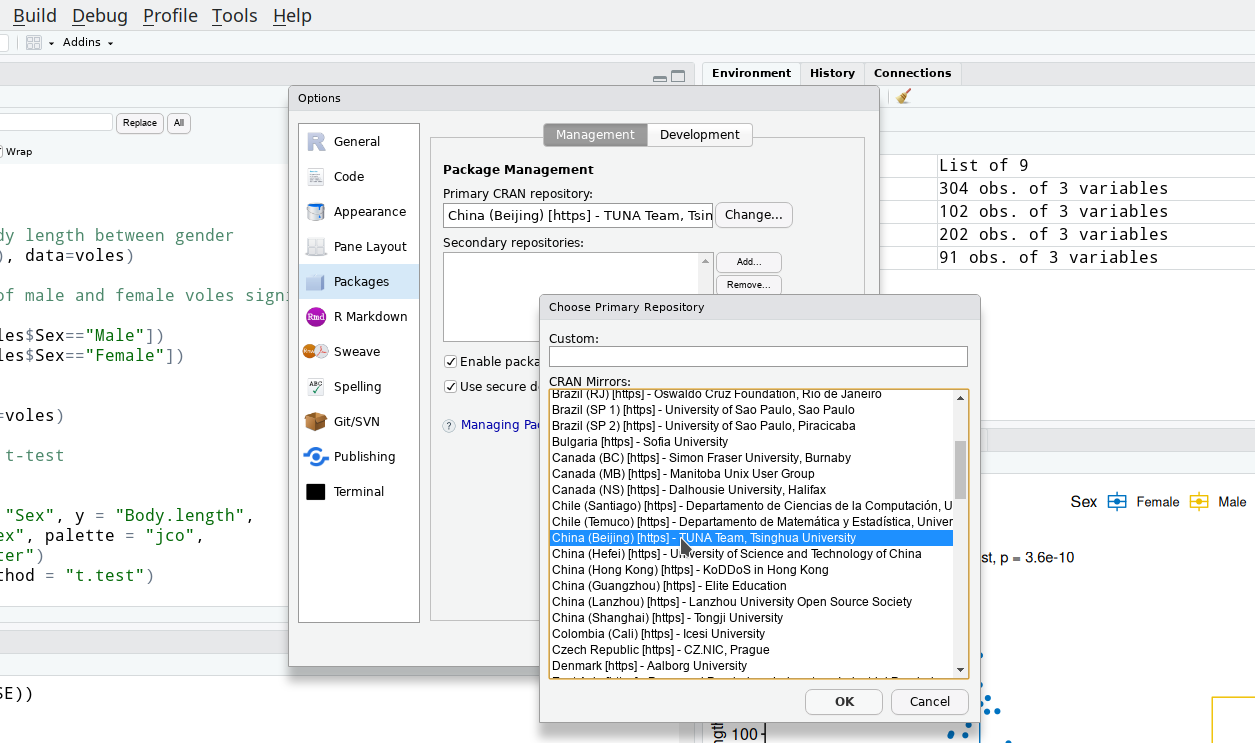
Change CRAN mirror
- Click
Tools-Global options-Packages - Change CRAN repo to TUNA
Package
install.packages("ggplot2")
require("ggplot2")
Workshop
- Copy the dataset
worms.txtto you laptop. - Test this hypothesis: Whether there is a statistically significant difference of worm density between in damp field and in dry field.